Matthew Van Egmond
Geographer + Photographer
About Me
Hey, I'm Matthew!
I specialize in geomatics and remote sensing, with a special interest in environmental monitoring and research.
I have hands-on experience working with multispectral data, LiDAR, SAR, and UAV photogrammetry, and am comfortable using ArcGIS, QGIS, Python, and R.
When I'm not making maps I fill my time with photography, astronomy, cycling, and sustainable urbanism.
Resume
Experience and Education
Experience
Parks Canada
Resource Conservation Summer Student
2022 - Present
For four summers working in Wapusk National Park I have assisted with the development and execution of remote environmental monitoring field research and data analysis, for both Parks Canada research and external researchers. Some projects include carbou population monitoring, water quality monitoring, and fish inventory using environmental DNA.
I also manage geospatial data and produce maps for the park, maintain an extensive network of trail cameras, science education, and community outreach.
Maitland Valley Conservation Authority
Ecological Monitoring Intern
March - May 2022
As a part of the Canadian Conservation Corps, I helped implement a species at risk montoring program, including owl monitoring through the Ontario Breeding Bird Atlas, amphibian surveys, and vegetation surveys. Surveys were created using Survey123 and ESRI software. Other duties included helping with habitat restoration.
Education
University of Manitoba
B.Sc. in Physical Geography (Geomatics)
April 2025
Through my degree I developed expertise in geomatics while building a strong foundation in physical geography. My coursework in Advanced Geomatics, Thematic Cartography, Geospatial Programming and Remote Sensing equipped me with technical skills in spatial analysis, data visualization, and satellite imagery interpretation.
I contributed to the community through volunteer work with the Environment and Geography Student Association, Parks Canada Campus Club, and the Lockhart Planetarium.
Universitat Politècnica de València
Exchange in Faculty of Geomatic Engineering
September 2023 - July 2024
My year-long exchange in Spain profoundly improved my understanding and skills in advanced geomatic topics such as SAR Remote Sensing, LiDAR, geospatial databases, photogrammetry, and geostatistics. Additionally, studying entirely in Spanish presented a unique challenge and opportunity for growth.
Skills & Expertise
Projects
My Past Projects
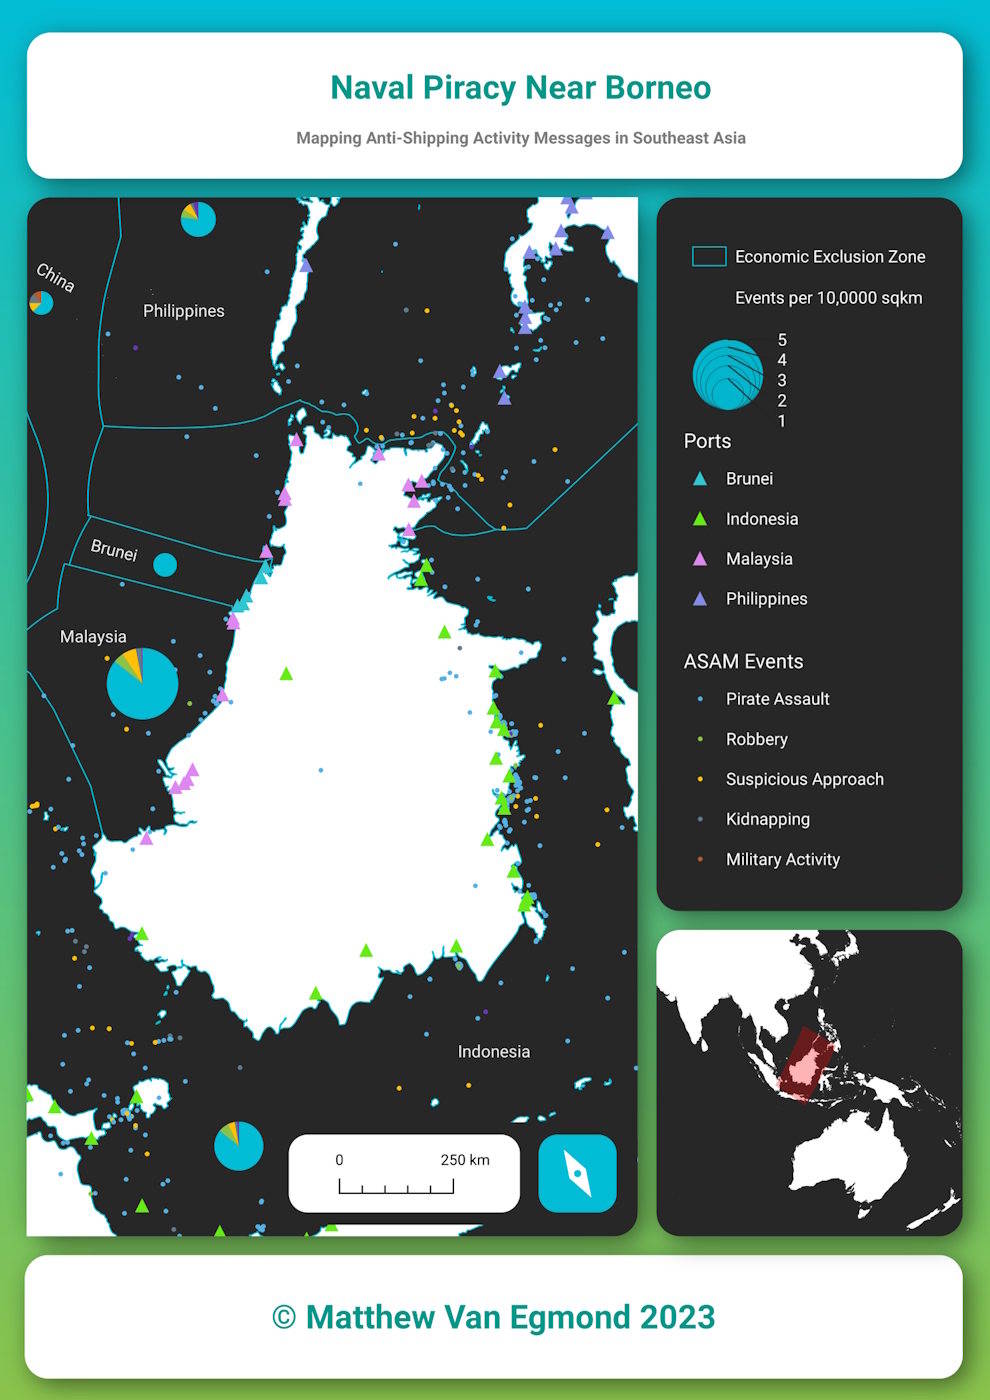
Naval Piracy Near Borneo
The map displays naval piracy incidents near Borneo using compiled data from Maritime Safety Information (MSI). In addition to incident locations, the map uses multivariate symbology to display the type and number of events per area for each countries Economnic Exlusion Zone. Created in 2023 for a university cartography project using QGIS.
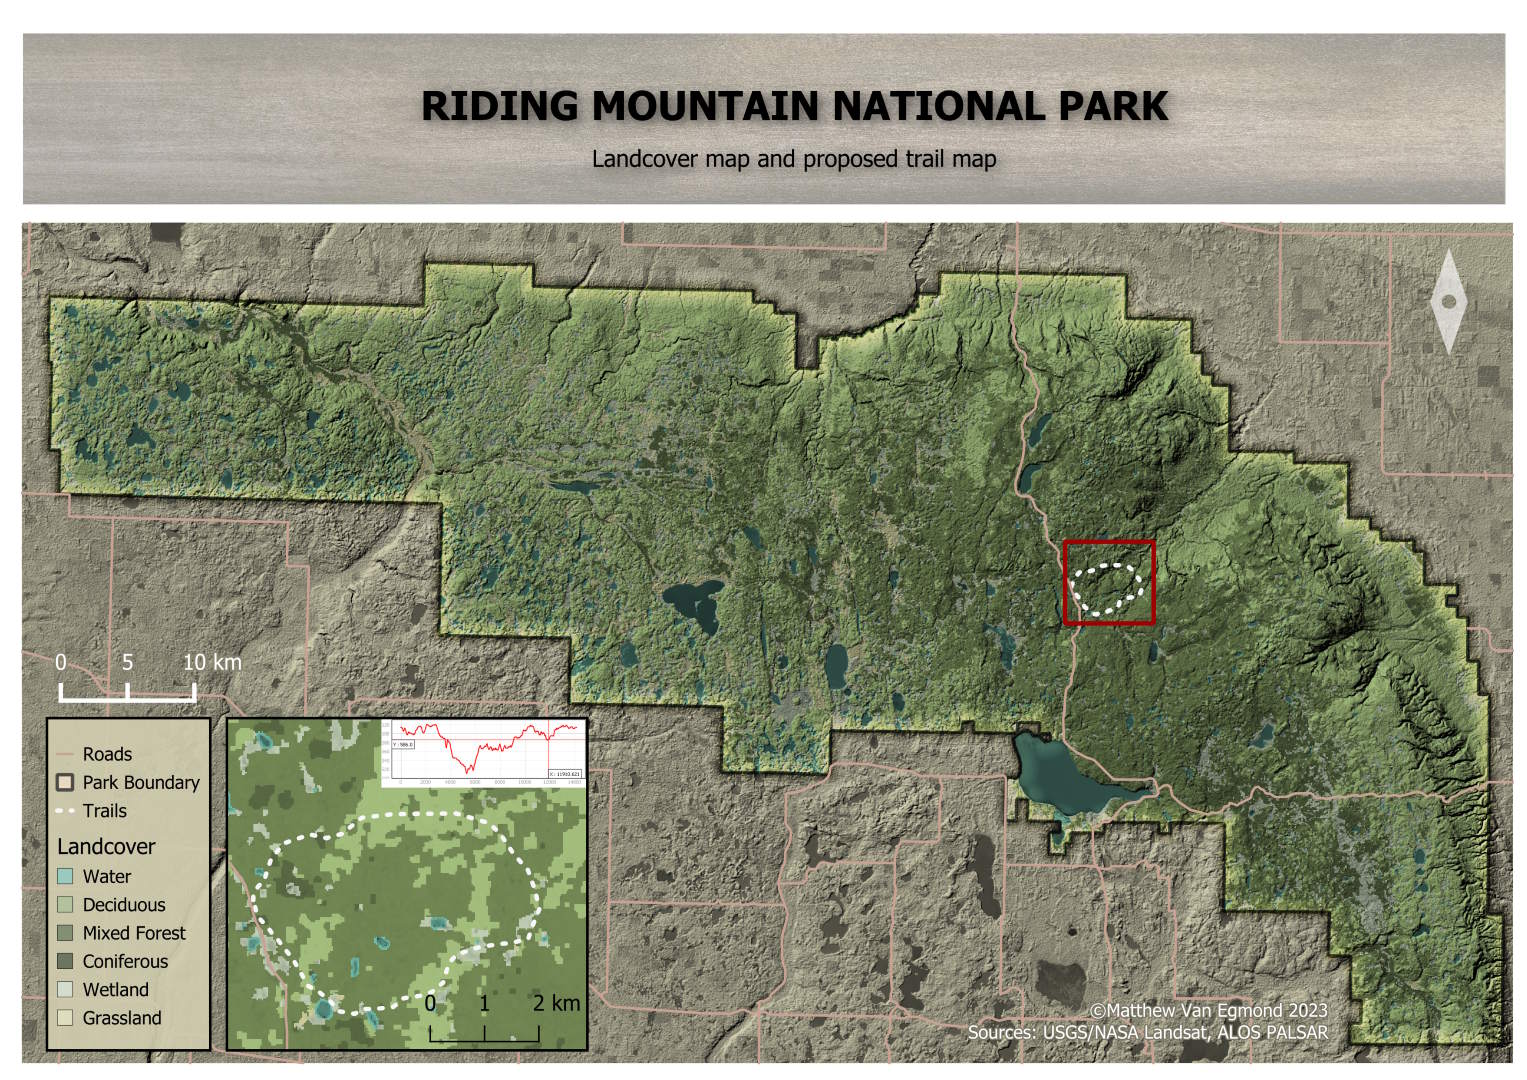
Riding Mountain NP Landcover Map
For this advanced geomatics university project, I used multispectral Landsat imagery to create a landcover map of Riding Mountain National Park. I used the Multispec software to perform both supervised and unsupervised classifications on the satellite imagery, and compared various statistical analyses to ensure the classifications were accurate. The supervised classification was used in the final landcover map. An NDVI layer was also produced, in order to propose a new trail in the park that passed through highly vegetated areas with several different vegetation types. The final map was produced using QGIS.
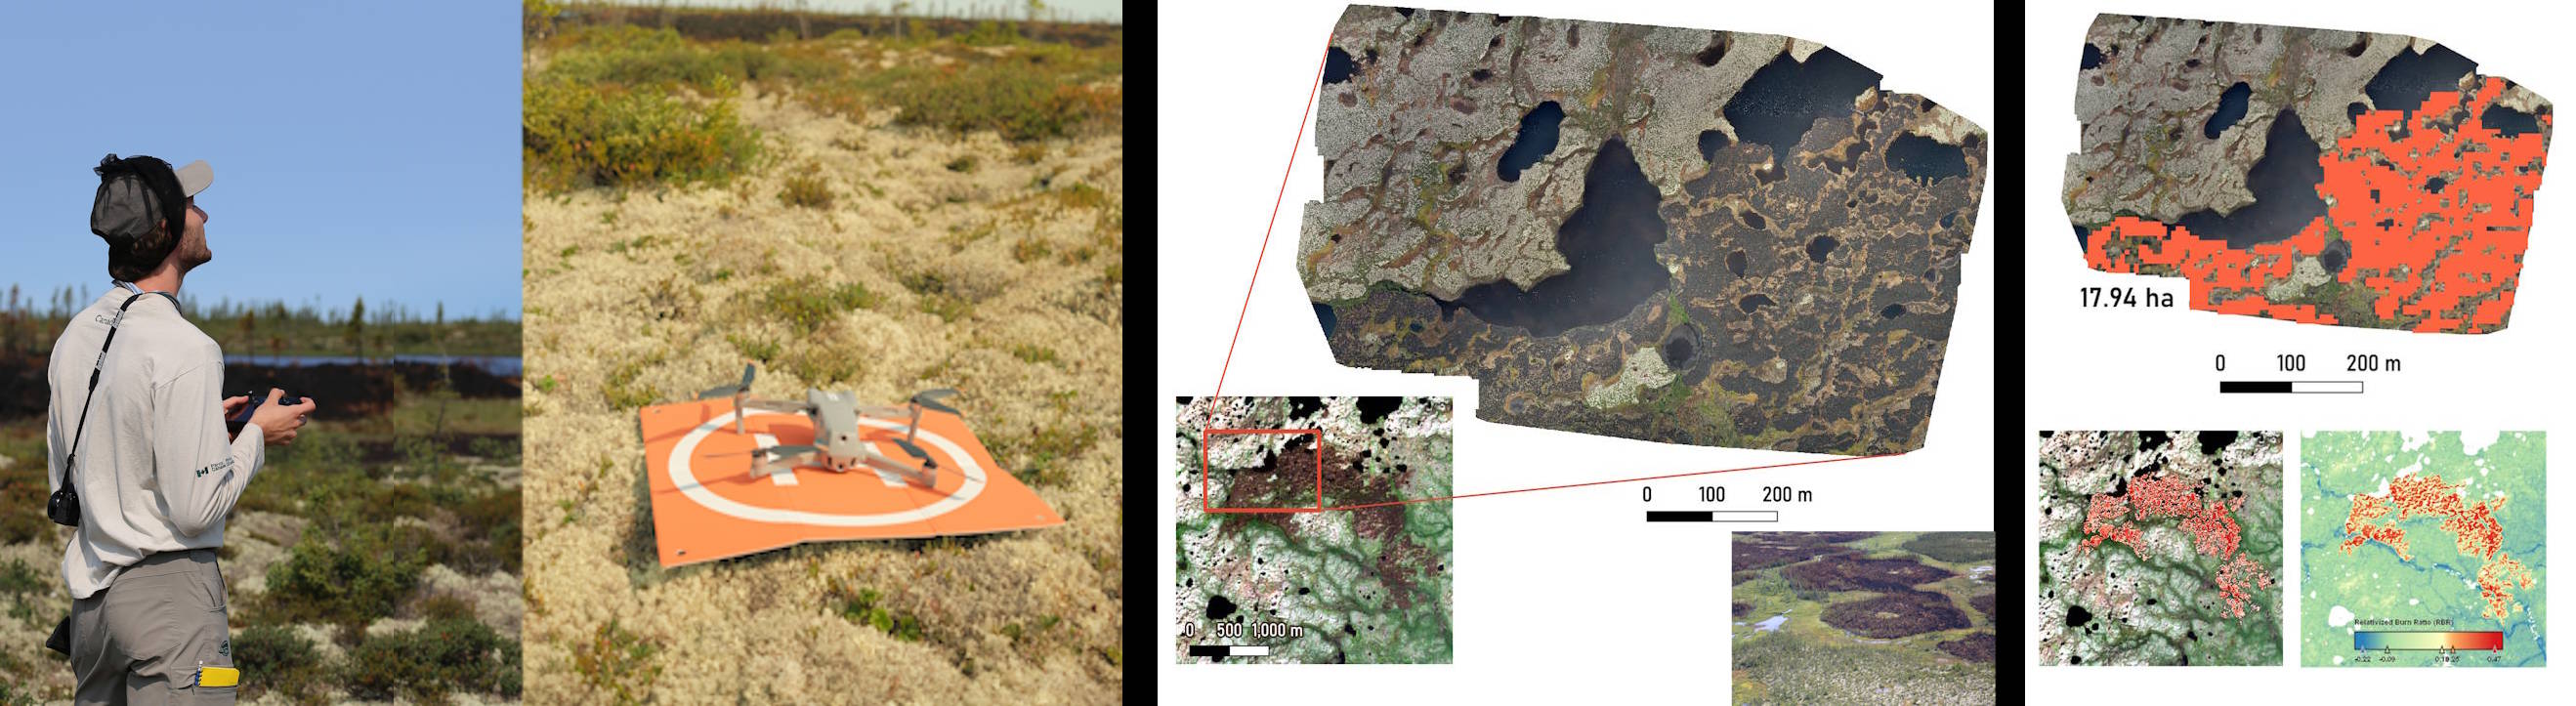
Wildfire Analysis
I led a post-burn wildfire analysis project in Wapusk National Park, using a UAV to create an orthomosaic of part of the burned area and multispectral Sentinel-2 satellite date to fully map the burned area. A DJI Air 2S was used to image part of the burn (left). WebODM was used to locally process the imagery into the final orthomosaic (center). The entire burned area was extracted using multispectral Sentinel-2 data to create a Normalized Burn Ratio map (right). The extracted area from Sentinel-2 data was then compared to manually measured area from the drone orthomosaic to confirm that satellite Normalized Burn Ratio accurately represented what was observed on the ground.
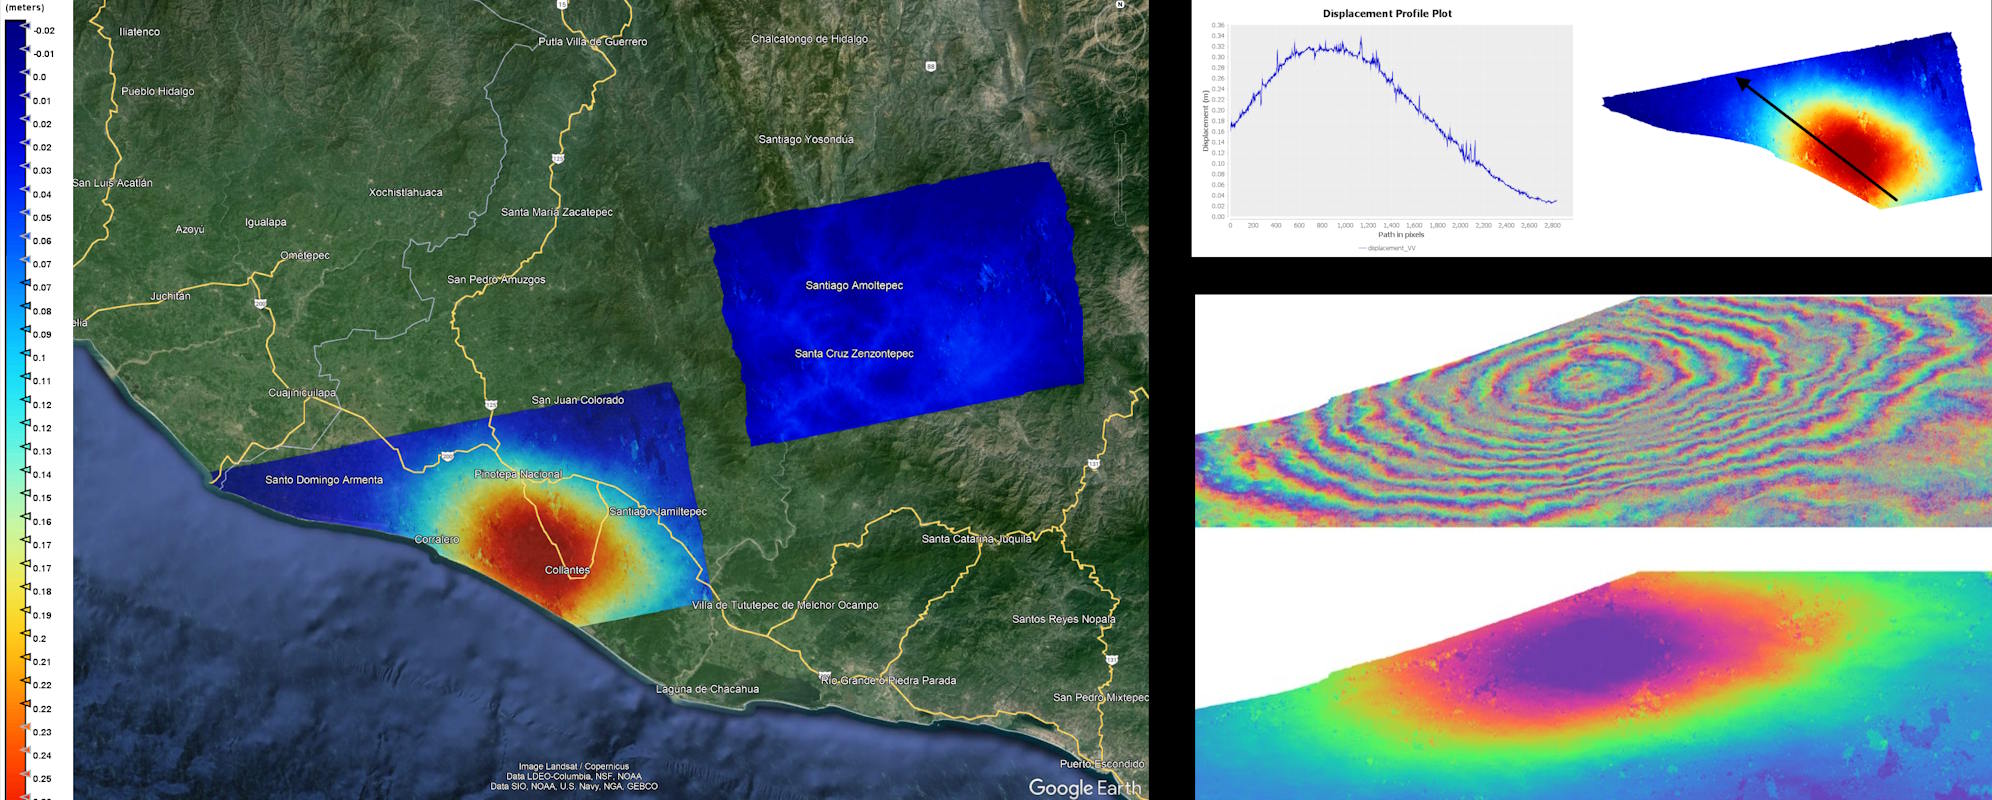
Oaxaca Earthquake DInSAR Analysis
For a final project at the Politechnic University of Valencia in Spain, I performed a surface deformation analysis of the 2020 earthquake in Oaxaca, Mexico using differential SAR interferometry. Sentinel-1 imagery from before and after the earthquake was analyzed using the SNAP software from the ESA. Unwrapped phase was converted to vertical displacement to create the map above.
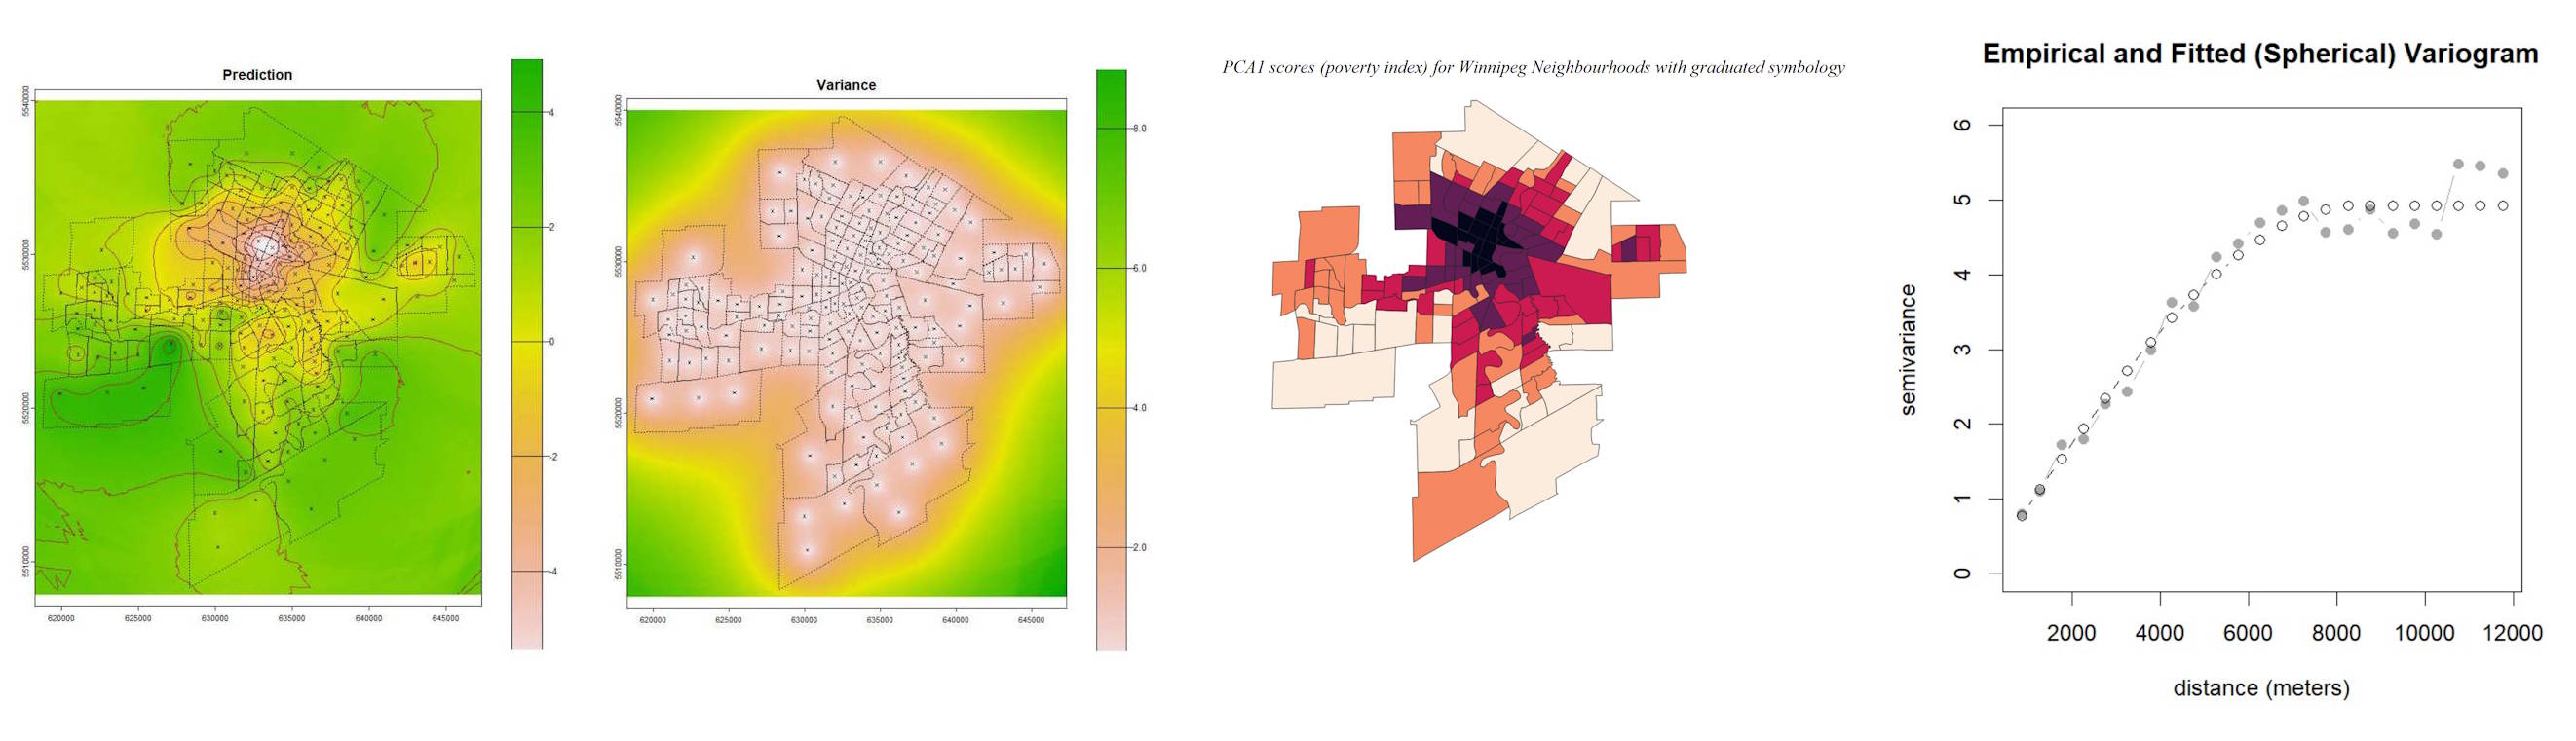
Winnipeg Poverty Index
Multiple neighbouerhood census variables were analyzed using a principal componenent analysis to create a poverty index in the city of Winnipeg, using the R statistical software (center). Geostatistical modelling packages were then used to create a continuous kriged interpolated surface of poverty in the city (left).
Daily camera trap occurrences
Analyzed camera trap data was used to create an animated map of daily polar bear occurrences at the cameras.